Aside

Markov Chains and Tennis

Now that the tennis season is well underway and the Australian Open is already a few weeks in the past, I thought I would look at a basic model of a game of tennis for today’s blog post. As you might expect there will be some maths later on, but feel free to skip that and just look at the pictures and the results!

The simplest way to model a tennis match as suggested by people such as O’Malley, is to look at the probability of players winning a point on their own serve. Then we can define the probability of a player winning a point on their serve as p, and the probability of losing a point on their serve as 1-p. These two probabilities can be used to build up a model of the entire match. Whilst this is clearly a simplification it has been shown to be a pretty good predictor of the overall winner of a match.

For example by checking the ATP website we can see that Roger Federer won 3737 out of 5202pts he played on serve last year, giving him an average probability of p=0.718 to win a point on his serve. Giles Simon only managed to win 3186 out of 5128pts on his serve and consequently had a more typical value of probability p=0.621 to win a game on his serve. Most top-50 ATP players had values in the range of 0.6 to 0.7 for the 2015 season, which is obviously pretty good!

tennis

See More…

Emergency Planning with OR

One recent talk that stood out to me was given by Marc Goerigk and talked about how operational research can be used to help improve evacuation planning for emergencies. For example unexploded WWII era bombs, Lancaster floods or terrorist incidents.

The ideas I will talk about are to do with using an optimisation approach to give a good lower bound on the evacuation time. Simulation techniques on the other hand are more useful for finding an upper bound on the evacuation time.

A clever thing to do when we are trying to model real world places is to try and represent the place in a network. Essentially we can take a map and represent it in a graph network using nodes and arcs. Arcs generally represent paths or roads and nodes the intersection of these paths and roads. This allows us to simplify tricky features such as curved roads into nice straight lines.

flatnetwork

Transforming a map of my flat into a network diagram

See More…

Multi-Armed Bandits

One of the classic problems in Statistics that a lot of people working at STOR-i in particular are involved with is something called ‘Multi-Armed Bandits’. In fact there was a recent conference on the topic and its applications at Lancaster earlier this year. In this post I will try to explain what the problem is and touch on how it is solved.

Originally this problem was first thought about in the casinos of Las Vegas. It concerns how to pick which slot machine out of a group you should play to try in order to try and maximise your total winnings. Whilst this problem is no longer just applicable to casinos, the name ‘one-armed bandit‘ has stuck and the casino analogy is what I will continue to use.

onearmedbandits

SEE MORE…

Pythagorean Expectation in Football

The use of data and statistics has grown rapidly in most sports in recent years. Nowadays many metrics and formulas exist for trying to measure and predict performances of players and teams. One of my favourite tools because of its simplicity is something called ‘Pythagorean Expectation‘.

The most famous early pioneer of baseball statistics, Bill James, came up with the original formula to predict the number of wins for a team over a baseball season, based on the number of runs they scored and conceded.

Win\% = \cfrac{RS^2}{RS^2 +RC^2}

To work out the number of wins in a season you simply have to multiply the win percentage by the number of games played. The reason James called it Pythagorean is because of the occurrence of all the squared terms. Whoever said Pythagoras Theorem was boring!

SEE MORE…

Input Modelling – Simulation

One of the more interesting topics that we looked at over last week was to do with input uncertainty in simulations. Generally in simulation we have a set of inputs into our model, which often take the form of some probability distribution. For example when we are trying to simulate queues, the arrival of customers into the system would be one such input.

Often we don’t need to know exactly what distribution should have been used as an input, since what we actually care about are the performance measures of the system. Thinking back to the queuing example, we care about facts like the expected number of people in the system and the fraction of time that the servers are working (server utilisation). It turns out that as long as we match enough good properties of the distribution, we can get the correct performance measures!

This is more easily seen in an example such as the M/G/1 queue, which has been solved analytically (mathematically). The mean length of the M/G/1 queue is given by the Pollaczek–Khinchine formula below.

E(Y) = \frac{\lambda(\sigma^2+\tau^2)}{2(1-\lambda\tau)}

As you can see the distribution for the time taken to serve a customer doesn’t matter itself, only the mean and variance of it does! Luckily this is often the case. Note that we also have lambda which comes from the fact that arrivals into the system follow a Poisson distribution, which is important.

So how do we find the properties of a distribution if we can’t use that distribution itself?

One way to tackle this problem is to use the idea of matching central moments. Here we want to try and mimic key properties of the distribution, so we can simulate new input data from it.  The basic idea is to pick parameters for F(x;\theta) (the true distribution) that match the properties of the real world data X.

Mean: \mu_{X} = E[X]

Variance: \sigma^2_{X} = E[(X-\mu_{X})^2]

Skewness: \alpha_{3} = E[(X-\mu_{X})^3]/\sigma^3_{X}

Kurtosis: \alpha_{4} = E[(X-\mu_{X})^4]/\sigma^4_{X}

Suppose that we indeed do have the first four central moments of our distribution, (\mu_{X}\sigma^2_{X}, \alpha_{3}, \alpha_{4}) and they all exist. Then there is a fairly standard trick that lets us match the mean and variance easily,

X' = \mu + \sigma(\frac{X-\mu_{X}}{\sigma_{X}})

The formula gives us an X’ with mean \mu and variance \sigma^2, but the same skewness and kurtosis as X. As a result it is not the matching of the first two central moments that poses a problem, but the matching of the next two!

Aside

Routing Electric Vehicles

Electric cars seem to be the way of the future, they are cheaper to run and better for the environment. However there has always been one thing holding them back in many people’s eyes: actually finding somewhere to recharge and the length of time needed to recharge.

Many companies continue to try and reduce the time needed to fully recharge a car battery, with a new generation of fast charging stations being able to recharge significantly a battery in around 30 mins. However one approach suggested by some companies is to simply swap batteries depleted with fresh ones at stations.

electric-car

One interesting talk given at that the recent STOR-i conference was presented by Pitu Mirchandani from Arizona State University in the United States. His work has been directed towards electric cars and the somewhat unique problems that crop up for the battery exchange models in particular.

He defined a new problem as the ‘Electric Vehicle Shortest Walk Problem’. Note that it is shortest walk rather than shortest path, as it takes into account the fact that vehicles will often need to take detours in order to recharge or swap batteries. This mean that the problem he had to deal with couldn’t be solved with traditional shortest path algorithms such as Dijkstra’s algorithm and he had to develop a new approach.

The two main things that need to be minimised are:

  1. The total distance detoured from the optimal route (the route with no stops)
  2. The total number of stops (to exchange batteries)

He went on to discuss further his ideas of other interesting problems that can be studied such as where to locate the battery exchange stations and how large they should be. This meant that he was able to propose a system that could decide where every car in the network should stop off on its journey to swap batteries. The point of doing this was that he found the overall total journey time of all the cars in the system was minimised. In particular it was substantially below the case when every driver made their own decision about where and when they chose to stop. So whilst drivers would lose their independence, all road users would benefit.

I should probably conclude by saying that nothing is the world of research is guaranteed. In fact it turns out that the man behind Tesla, Elon Musk, has since changed his mind on battery exchange technology following an unsuccessful pilot. He suggested that people just prefer being able to recharge their car! This appears to be for several reasons, not least of which that recharging at their solar powered superchargers is free and using a battery exchange station costs the same as a fresh tank of petrol!

An Introduction to Changepoints

As you probably know Statistics is often used to try and analyse data. There are all different types of data, but the data we are interested in studying in this post is that of time-series data. This is exactly what it sounds like: information collected about some process over a time period. This time period can range from the small scale of seconds for signal processing all the way to larger scales such as years as seen in financial data.TimeSeries
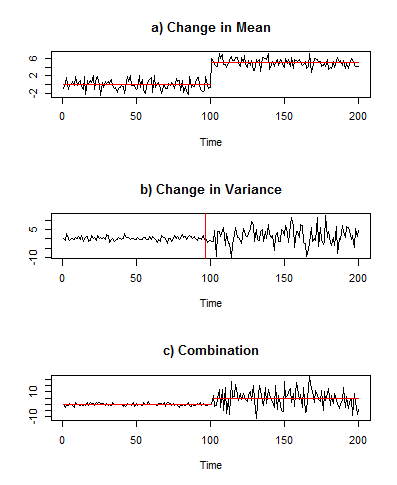
When we look at time-series data we often see sudden changes in the pattern of the data. We use the term ‘changepoints’ to describe the places where this occurs. In a more mathematical sense changepoints tend to happen when there is some change in the parameters of the data, i.e in  the mean or variance of the series. Sometimes changepoints even occur when more than one parameter of the data changes.ChangepointsThe time-series data that changepoint analysis is used for crops up in many different disciplines. In finance it is needed to keep track of volatility in the stock market, whilst climatology harnesses it to detect changes in the mean temperature of the planet. Even new fitness technology like activity trackers make use of it. In fact just about anything that has some variation over time could have changepoint analysis applied to it, making it worthwhile and active area of statistical research.

Stéphane Robin from AgroTech Paris recently gave a presentation at the recent STOR-i Conference where he talked about the role of changepoints in genomics. This is a sub-area of genetics to do with measuring data about DNA and RNA which is found along the chromosomes. It turns out that collecting this data along the genome is akin to a time-series, since there is so much of it! Particular experiments often aim to find regions of the genome where a specific event occurs, which makes changepoint analysis an incredibly useful asset to genomics.

This slideshow requires JavaScript.

The slides above illustrate some of the data that changepoint problems have to frequently solve in genomics.